Date:
Thursday, August 31, 2017


You can contact LEARNZ, part of CORE Education, at:
Postal Address:
PO Box 13 678,
Christchurch 8141,
New Zealand
Kia ora koutou,
Floods are a common natural hazard in New Zealand and can cause widespread damage. Today you looked at where there are flood hazards and how these are mapped.
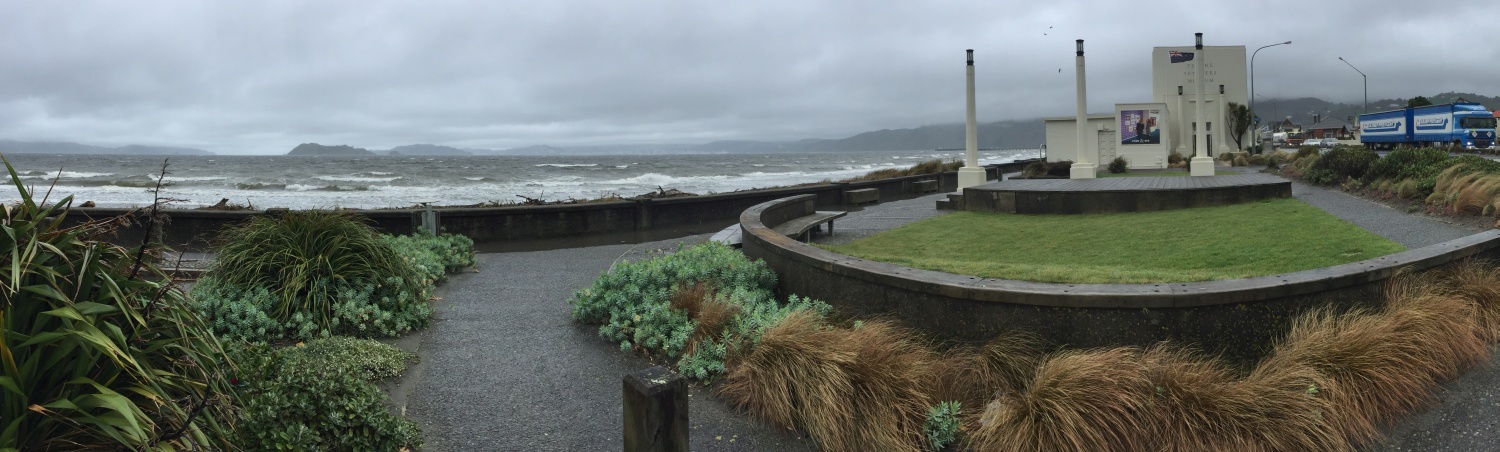
You began the day at the Greater Wellington Regional Council office down by the Port. You met Sharyn Westlake who is an engineer working in the flood department. Sharyn answered questions from Longford Intermediate during the web conference. Students asked lots of challenging questions. You can listen to a recording of this web conference.
Identifying flood-prone areas
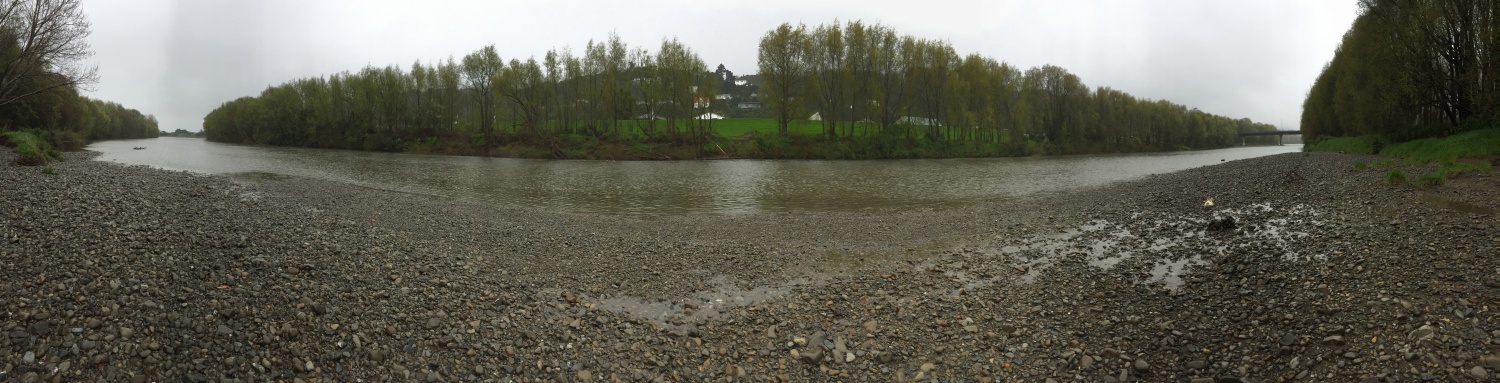
Following the web-conference you headed out to Lower Hutt to look at an area that often floods. You had to brave a cold wind and rain but this seemed appropriate given the topic for today. Sharyn took you to a section of the Hutt River which normally runs clear. With all the rain that fell overnight the river was brown and flowing swiftly. At least it has not rained enough to cause any flooding. Sharyn explained that it is natural for rivers to flood regularly. It is only when people decide to build next to a river that flooding becomes a problem. You can watch the video about this.
Flood management
Stop banks have been built alongside the river. Stop banks help to stop flood waters from spreading into nearby houses and buildings. Sharyn showed you photos of the car park that you were standing in that often gets flooded. It was hard to believe that such a large area can get covered in water. The easiest way to manage flooding is to move people away from the flood, rather than trying to move the water. People need to think about how they use areas that flood often rather than building on them. It is also helpful to know what has happened in the past. You visited Petone Settlers Museum to find out more about the history of Wellington. You discovered that Petone had flooded in the past. The people who first tried to build a town here shifted to Thorndon after the area flooded. Watch the video about this.
Modelling floods
Sharyn talked about how aerial images and LiDAR are used to map rivers. Then information on past river levels and rainfall are put into a model to estimate future flood levels. The more information recorded the more reliable models are in predicting flood levels. These models help the council to manage areas at risk of flooding. In some areas, the height of stop banks are being increased to help keep parts of Wellington safe from floods. Keeping records of floods helps experts to estimate the return period of floods. Floods are described by how often they are likely to happen. You may have heard of a flood being described as a one in one-hundred-year flood. This doesn’t mean that this flood will only happen exactly once every hundred years. It means that this flood has a one percent chance of happening every year. Sharyn joked about how excited she gets when there is a flood. Each big flood helps Sharyn to collect more information. This information helps to make her flood prediction models more accurate. These models are helping people to stay safe. They issue warnings which give people time to evacuate before flooding begins.
Measuring floods
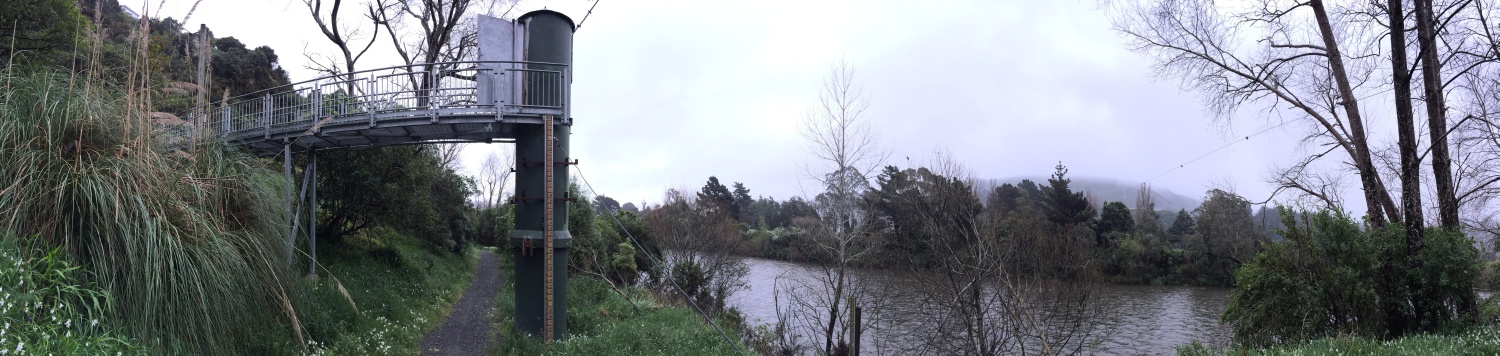
There are many ways to measure floods and rainfall. You met Mike Harkness who is a hydrologist with the Regional Council. Mike took you to a Stilling Well next to the Hutt River. This is a well that extends down into the river and allows a measurement of the water level to be made. You also saw how a rainfall gauge works by collecting and measuring rainfall. You can see this in the video. There is a network of monitoring devices around the Hutt River catchment. Technology is making it easier to record, analyse and share this information. In the past people would need to go out and record river levels but now it can be done automatically.
Making maps
To see how useful information on river and rainfall levels are, you headed to Naenae College. Students used information from the council to create their own ArcGIS flood hazard maps. You too can try this activity. It was impressive to see how quickly students could create these maps. They were able to see if their own home would be affected by a large, medium or small flood. Watch the video about this.
Over the last three days you have looked at a variety of natural hazards in Wellington. You have learnt how to identify where hazards pose the most risk. You can see Wellington's hazards on this Story Map created by Eagle Technology. You have seen how useful it is to know the location of things and understand the environment where you live. I hope you have enjoyed the field trip and that it will help you find resilience!
See you on another field trip soon,
Shelley the LEARNZ field trip teacher.
Follow our journey on this map:

Shelley and Sharyn talk to Longford Intermediate School during today's web conference. Image: LEARNZ.

Rain overnight left the Hutt River looking browner than usual. What causes this change in colour? Image: LEARNZ.

Sharyn and Shelley take a closer look at the Hutt River and the areas that it floods. Image: LEARNZ.

This stop bank has been built to stop the spread of flood water from the Hutt River. Where are stop banks needed? Image: LEARNZ.

This is a Stilling Well used to measure river levels. How do you think it works? Image: LEARNZ.

Mike the hydrologist talks to Shelley about how river levels are measured. Image: LEARNZ.

River levels can also be read by looking at heights on a pole like this. Why do you think the levels measured in a Stilling Well are more accurate than these? Image: LEARNZ.

Alvin takes a look inside a rain gauge. How do you think this rain gauge works? Image: LEARNZ.

You visited Petone Settlers Museum to see how history can help us better understand risks such as flooding. Image: LEARNZ

Students from Naenae College create their own flood hazard maps. Image: LEARNZ.
