

What lies beneath?
Discovering the secrets of our seabed.
About this field trip
Kia ora! Embark on a virtual adventure alongside a hydrographic surveying team aboard Tupaia, a purpose-built survey vessel, to map the seabed off Te Tai Rāwhiti. This virtual field trip will immerse ākonga in the world of geospatial science and data technology.
Seabed surveys also allow us to build detailed 3D maps of the seafloor, providing valuable information about the marine environment. Communities, businesses, local councils and central government agencies can use this data for flood modelling, environmental management, marine research, and much more.
Objective
To highlight the importance of geospatial data and technology in seabed mapping and the pivotal role this data plays for marine navigation and diverse stakeholders, including iwi for customary rights and the Department of Conservation for environmental restoration.
Key learning
Gain insight into the world of hydrographic surveying and its real-world applications.
Explore advanced technology used in mapping the seabed and its broader applications.
Engage in hands-on learning by utilising GIS software and analysing real-world data.
Develop a greater appreciation for the natural environment and the importance of data-driven decision-making.
Student-led inquiry
Empower your ākonga to take charge of their learning journey. Encourage them to ask meaningful questions, explore resources, and embark on their own conservation or geospatial projects.
Curriculum alignment
This virtual field trip aligns with the refreshed New Zealand Curriculum (2022). It covers a range of learning areas, predominantly science, technology and social sciences. Access guidance to support teaching and learning with a suggested framework, reflective questions, and activity ideas to complement the virtual field trip and align with curriculum goals.
Educator guide
Curriculum highlights
This virtual field trip aligns with Te Mātaiaho, the refreshed New Zealand Curriculum (2022). It integrates key learning areas in science, technology, and social science by offering a rich educational experience about seabed mapping (hydrographic surveying).
Ākonga will see how hydrographic surveys improve navigation, marine management and our understanding of what lies beneath the surface of the water. Communities, businesses, local and central governments can use this data for flood modelling, aquaculture development, and preserving cultural heritage.
Curriculum flexibility
Our field trips are cross-curricular learning experiences which can be adapted to different learning areas and progressions. You can develop your teaching approach to suit ākonga interests and needs.
Learning areas and achievement objectives
-
This field trip is designed for students in years 7-10, especially at level 4 of the Science learning area including level 4:
Nature of Science (Understanding Science)
Ākonga can gain insights into collaborative scientific work, observe how scientists employ technology for data collection and analysis to solve real-world problems. This helps ākonga understand how scientists collaborate and use evidence to support their ideas and conclusions.Physical World (Physical Inquiry and Physics Concepts)
Ākonga will explore the practical application of physics concepts and laws. For instance, they can examine how echo sounders and mobile laser scanning measure depth so that the seafloor can be mapped. -
This field trip is suitable teaching for level 4 of the Technology learning area including level 4.
Nature of Technology
Students will:Characteristics of technology
Understand how technological development expands human possibilities and how technology draws on knowledge from a wide range of disciplines.Characteristics of technological outcomes
Understand that technological outcomes can be interpreted in terms of how they might be used and by whom, and that each has a proper function as well as possible alternative functions. -
Mapping the seabed allows government agencies to make informed decisions about marine resource management, supports iwi in preserving cultural heritage and livelihoods, and benefits the broader community involved in marine activities by enhancing navigation, safety and environmental sustainability. Encourage ākonga to explore the social dimensions of hydrographic surveying.
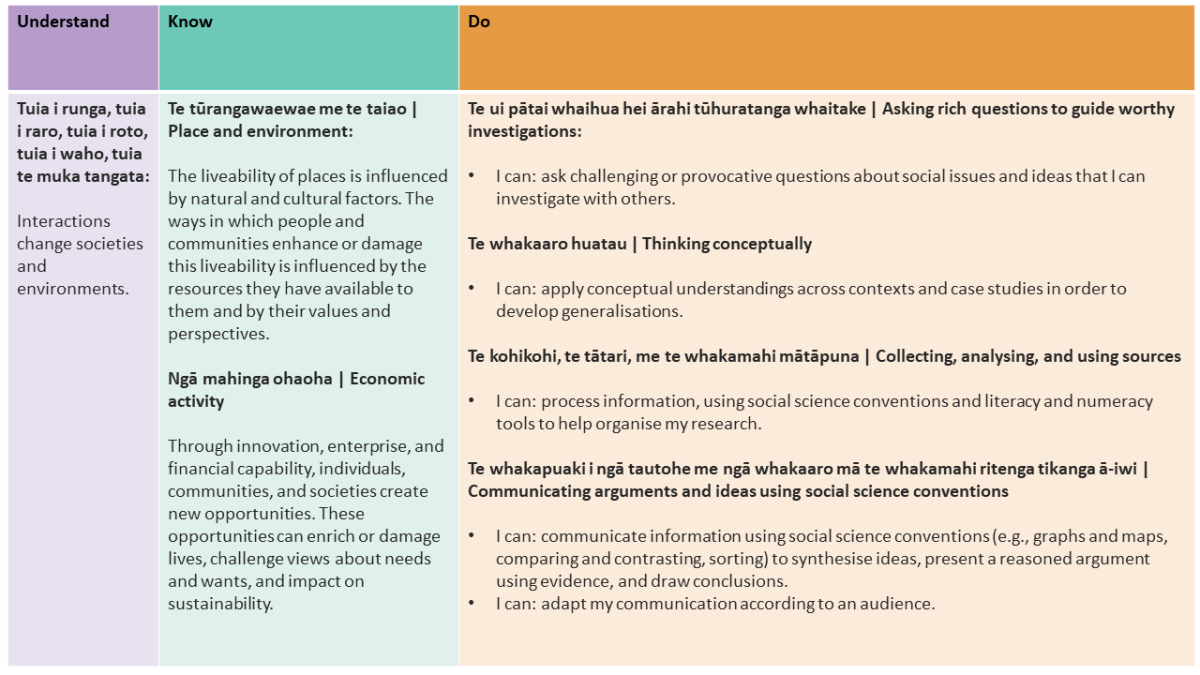
Te ao tangata | Social sciences example
This virtual field trip can effectively support progress outcomes in Phase 4 (Years 9-10) of Te ao tangata | social sciences defined by the Understand, Know, and Do (UDK) framework..
Reflective teacher questions
Use the following reflective questions to guide your teaching practice:
How can I help my ākonga connect the topic of mapping our seafloor to scientific and social ideas?
To address this question you can:
Explore real-world examples and practical applications of seabed mapping in the field trip, considering its impact on various sectors and communities.
Encourage discussions and group activities that highlight the interdisciplinary nature of this field.
Why is it important to consider the broader impacts of understanding more about our seafloor?
To address this question you can:
Discuss how seabed mapping contributes to marine conservation, resource management, and disaster preparedness.
Explore the economic, environmental, and cultural consequences of informed decision-making based on hydrographic data.
Connect this understanding to Sustainable Development Goal 14, "Life Below Water," and its global significance.
How can I raise awareness among my ākonga about learning opportunities and career pathways related to mapping our seafloor, motivating them to consider future possibilities in this field?
To address this question you can:
Invite relevant professionals or experts to share their experiences and career paths with ākonga.
Share information about educational opportunities related to seabed mapping.
Incorporate hands-on activities or projects that allow students to explore the practical applications of seabed mapping.
Showcase the potential for making a positive impact on society and the environment through careers related to seabed mapping
A suggested teaching and learning framework
This approach aligns with the Understand, Know, Do (UKD) framework of Te Mātaiaho, supports learning progressions in social sciences, and reflects current science and technology learning objectives by promoting critical thinking, independent inquiry, and collaborative investigation.
Introduce and explore -> Extend learning -> Evaluate -> Enable ākonga-led inquiry -> Present and share -> Reflect
1. Introduce and explore
Start by introducing the field trip objective, highlighting the value of mapping our seafloor.
Evaluate prior learning
Use the pre-trip survey (downloadable Word document) to assess ākonga thoughts and understanding related to seabed mapping and ignite their interest in the trip. You can incorporate this survey into interactive platforms like Kahoot!, Google Forms, or Quizlet.
Dive into the field trip resources, such as videos, images, and GIS maps, to discover the importance and techniques involved in seabed mapping. Ākonga can use the Videos - Play & think (downloadable PDF) to take notes and support group discussions and learning.
2. Extend learning
Engage ākonga in activities designed to spark discussions and foster an understanding of concepts highlighted in the field trip, with a focus on the important role of mapping our seafloor. Employ the Field trip activities to reinforce this approach.
Evaluate ākonga learning
Assess readiness and stimulate thinking about the importance of understanding our seafloor and encourage ākonga-led inquiry.
Use the post-trip survey (downloadable Word document) to measure the depth and progress of ākonga learning concerning the importance of mapping our seafloor.
Use this Solo taxonomy rubric (downloadable Word document) to assess ākonga understanding of the role of seabed mapping.
3. Enable ākonga-led inquiry
Empower ākonga to take the lead in independent or collaborative inquiries with a specific focus on mapping our seabed, the people doing this mahi, or the techniques they use. Encourage them to generate open-ended questions and challenges related to this field.
For example:
Environmental impact: How does mapping our seafloor contribute to maintaining the health and safety of our marine environment?
Technological advancements: What are the technological innovations that assist in mapping our seabed?
Social impact: How do hydrographic surveys help people, groups, communities and iwi? What positive changes can it bring to our lives?
Career opportunities: What exciting career opportunities are available in relation to mapping the seabed and how can you get there?
Encourage ākonga to explore topics, seek information, connect with experts, and gather data for inquiries related to mapping the seabed, its applications, and exciting prospects in this field.
4. Present and share
Support ākonga to present and share their learning. This could include, but is not limited to, digital storytelling, websites, podcasts, exhibitions, video, community engagement.
Evaluate ākonga learning
Assess ākonga-led inquiry and critical thinking using this Solo taxonomy rubric (downloadable Word document) as a guiding tool.
5. Reflect
After completing their inquiries and sharing their findings, encourage ākonga to reflect on what they've discovered about mapping the seabed. How has their understanding developed? What does this mean for them?

This field trip aligns with SDG 14: Life Below Water. The emphasis on seabed mapping and its contribution to marine navigation and environmental management aligns closely with SDG 14's goal of conserving and sustainably using the oceans, seas, and marine resources. It also reflects SDG 4: Quality Education. Highlighting geospatial science and technology supports the goal of providing a quality education and fostering experiential learning for students.
Goal 14: Life below water: To conserve and sustainably use the world's oceans, seas and marine resources.
Goal 4: Quality Education: Ensure inclusive and equitable quality education and promote lifelong learning opportunities for all.
Discover more
Select a topic or image link for background information, images, narrations, and Māori kupu | key words for each topic.
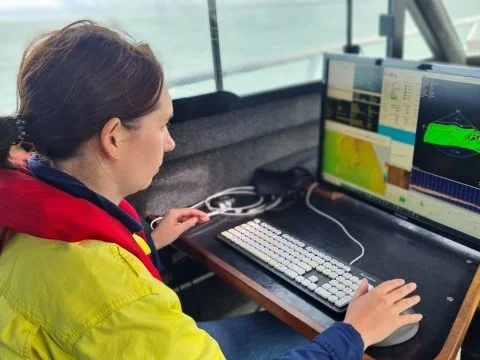
Career spotlight
Learn more about our field trip experts from Discovery Marine Limited (DML) and their exciting careers in hydrography.
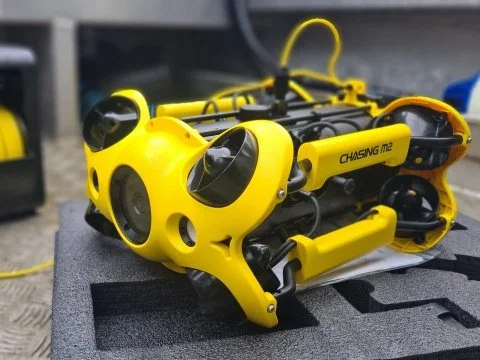
Challenges and future innovations
Let's dive into what's up with the future of hydrographic surveying.
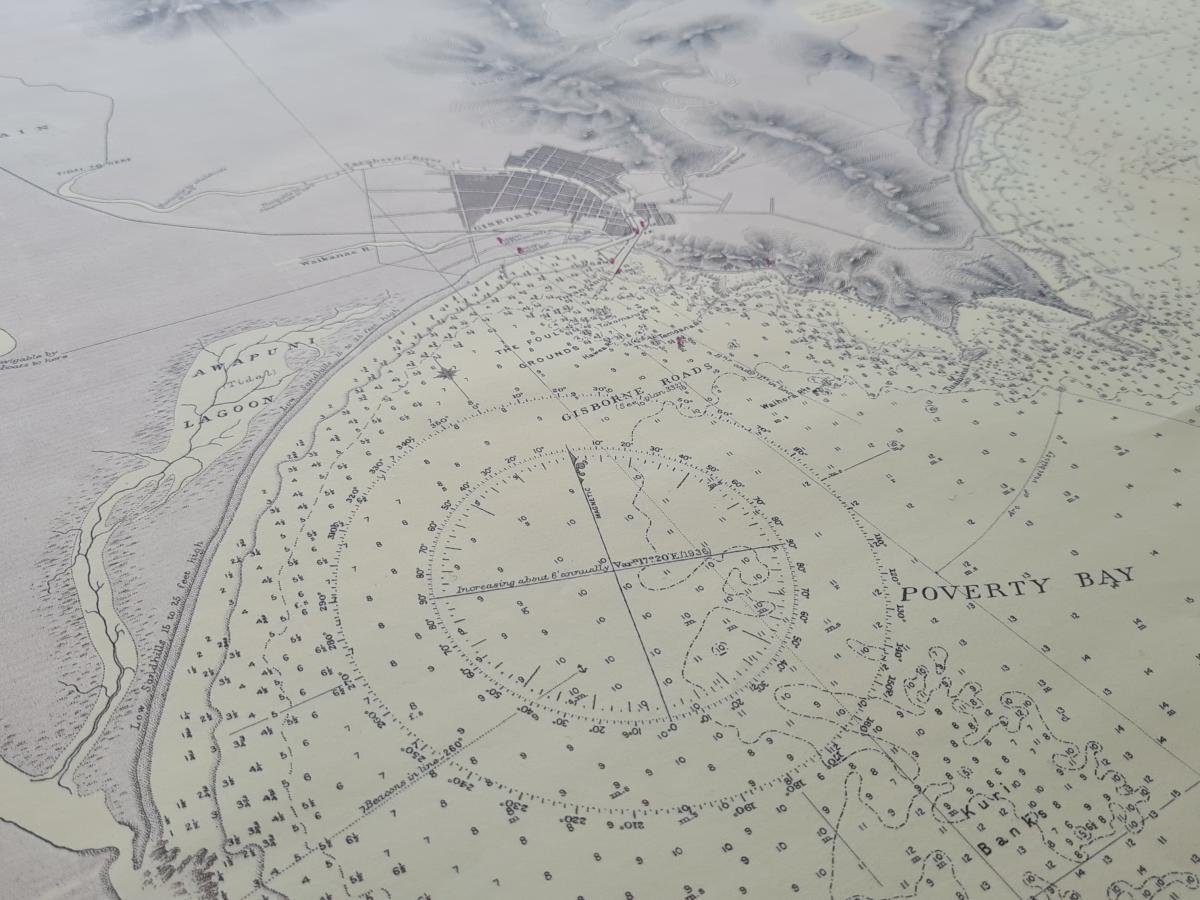
Navigating the ages
Long before GPS and Google Maps, Polynesian ancestors such as Kupe were the masters of navigating the vast Pacific Ocean.
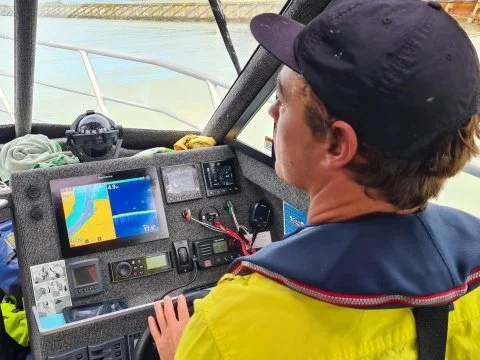
Charting the unknown
Let's dive into why mapping the ocean with nautical charts is a big deal.
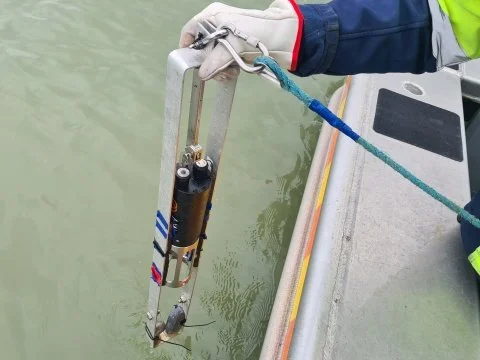
Tools of the trade
Ever wonder how we get those awesome maps of the ocean floor, complete with shipwrecks, underwater mountains, and all that?
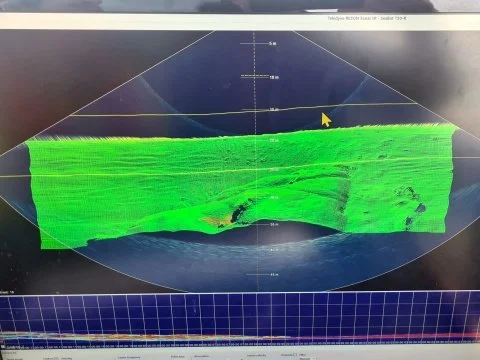
Exploring the depths
Imagine you're a pirate looking for treasure, or maybe you're steering a giant cruise ship. How do you avoid crashing into hidden underwater mountains or finding the best path through the sea?
Connect with field trip experts
Meet Brad
Meet Brad
Brad is a Matanga Tatai Wahi Matua, Senior Geospatial Specialist at Toitū Te Whenua Land Information New Zealand.
Meet Hayes
Hayes is a Senior Hydrographic Surveyor, Port Services Lead at Discovery Marine Limited.
Meet Kate
Kate is a Senior Hydrographic Surveyor at Discovery Marine Limited.
Meet Rian
Rian is a Senior Hydrographic Surveyor, Survey Services Lead at Discovery Marine Limited.
Field trip videos
What is hydrographic surveying?
The field trip kicks off overlooking Tūranganui-a-Kiwa Poverty Bay. Brad from Toitū Te Whenua Land Information New Zealand (LINZ) takes us through the what, why and how of hydrographic surveying.
Explain what hydrographic surveying is in your own words.
Why do nautical charts need to be updated?
Apart from updating nautical charts, what other reasons are there for seabed mapping?
Aboard Tupaia | The multibeam sounder
All aboard! Head out into Tūranganui-a-Kiwa Poverty Bay with the Discovery Marine Limited hydrography team. Senior Hydrographic Surveyor, Kate, is at the surveyor's desk and talks us through how the multibeam echo sounder works.
How many beams does the sounder on Tupaia send out?
What does the sounder measure?
Positioning – how do we know where we are?
Rian from Discovery Marine Limited explains the technology behind knowing their position anywhere and anytime while out on the water.
What is the primary technology used by the crew to know where they are?
What does the motion sensor do?
A skipper’s role in seabed mapping
Tupaia's skipper, Jordie, gives an overview of the skipper's role during seabed surveys and why this is such an important link with the rest of the crew.
What are some of the things a skipper needs to look out for to ensure safe boat operation?
Why might a skipper choose to not rely totally on a nautical chart for an area?
Seabed survey gadgets
Hayes from Discovery Marine Limited shows us three cool pieces of kit that the hydrography team use when conducting seabed surveys.
What can change the speed of sound waves travelling through the water column?
How does the grab sampler help hydrographers with their seabed surveys?
What might an ROV take video footage of?
Processing the collected data
Get an idea of how the data collected during a seabed survey is processed.
What is meant by "cleaning the data"?
What are the benefits of updating nautical charts?
Using the data back at Toitū Te Whenua Land Information New Zealand (LINZ)
A lot of work goes into collecting data during a seabed survey. How is this data used to create a nautical chart for mariners to use?
What two things is the survey data downsampled to when making a basic nautical chart?
What are the main differences between a small scale and large-scale chart?
Helping improve management of marine resources
At Te Tapuwae o Rongokako marine reserve, Brad from Toitū te Whenua Land Information New Zealand (LINZ) explains the environmental application of seabed mapping.
What is used to determine fish life living in an area?
What sorts of areas would be worth putting into marine reserve?
Take the Google Earth tour
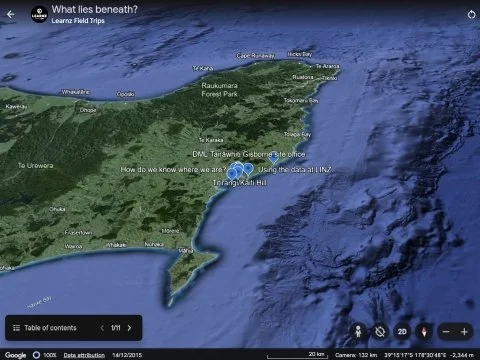
Take the Google Earth for Web Tour
A virtual tour of the field trip with GIS mapping, 3D locations, 360° panoramic images, videos, and further information.
Web conference
Replay the web conference with Brad from Toitū Te Whenua and Hayes from Discovery Marine Limited, and questions from Huapai District School.
Resources and links
Toitū Te Whenua Land Information New Zealand
A website providing information and services related to land and property in New Zealand.LINZ data system: New Zealand marine charts
Marine charts of New Zealand for commercial shipping and recreational boating.Discovery Marine Limited
The DML website outlining their marine surveying services in New Zealand.
For more about hydrography careers, have a look at the videos and links on the DML careers page.National Geographic Education - Mapping & Technology
National Geographic's educational section on this website provides various mapping and technology resources for educators.Geospatial World
A comprehensive website resource for news, articles, and insights on geospatial technology and its applications.Esri's GIS
Esri, a major GIS software company, provides educational resources, lessons, and software tools for teaching geospatial concepts.Google Earth for Web
An online mapping and geographic information tool developed by Google, allowing users to explore 3D satellite imagery, maps, and geographical data from around the world through a web browser.
Glossary
Bathymetry
Bathymetry is like creating a 3D map of the ocean floor. Just like a map shows mountains and valleys on land, bathymetry shows us the hills and trenches beneath the waves.
Chronometer
A precision timekeeping device crucial for determining longitude by comparing the local time to a known reference time.
Data
Information collected during surveys, used to create maps and charts.
Dead reckoning
A method of estimating a ship's position based on previously determined positions, and advancing that position based on known or estimated speeds over elapsed time, along with the direction of travel.
GNSS (Global Navigation Satellite System)
A broader term for satellite navigation systems that provide autonomous geo-spatial positioning with global coverage.
GPS (Global Positioning System)
A satellite-based system that provides precise location and time information anywhere on Earth.
Hydrographic survey software
Computer programmes used to process, interpret, and visualize data collected during hydrographic surveys, transforming raw data into comprehensible maps and charts of the underwater world.
Hydrography
The science of mapping and understanding the physical features of water bodies and their surroundings.
Inertial navigation technology
A type of navigation that uses motion sensors (accelerometers) and rotation sensors (gyroscopes) to continuously calculate by dead reckoning the position, orientation, and velocity of an object without the need for external references.
Mapping
The process of creating maps, which involves the collection, analysis, and presentation of geographical data.
ROVs (Remotely Operated Vehicles)
Unmanned submarines controlled remotely, used for exploring underwater environments too tight or dangerous for human divers.
Lead line
A tool for measuring the depth of water by dropping a weighted line and measuring the length of the line that reaches the bottom.
Multi-beam echo sounders
Advanced systems that emit multiple sound beams simultaneously to map a wider area of the seafloor, offering a detailed view of its topography.
Nautical charts
Detailed maps used for navigation on the water, showing depths, hazards, and other important features.
Polynesian navigators
Ancient mariners of the Pacific Ocean who mastered the art of navigating vast distances without modern instruments, relying instead on natural cues.
Sextant
A navigational instrument used to measure the angle between celestial objects and the horizon, aiding in determining latitude.
Single-beam echo sounders
Devices that use a single sound pulse to measure the depth directly beneath them, providing precise but narrow coverage of the seafloor.
Sonar
A technology that uses sound waves to detect and measure distances underwater.
Star navigation
The technique of using stars and constellations as guides for determining one's position and direction while at sea.
Stick charts
Navigational maps made from sticks and shells, representing ocean swells, currents, and island locations, used by Polynesian navigators.
Wayfinding
The traditional Polynesian method of navigation using environmental signs, including the stars, ocean swells, wind patterns, and the behaviour of birds.